Documentation Index
Fetch the complete documentation index at: https://runway-5055a12e-permissions-v2-docs.mintlify.app/llms.txt
Use this file to discover all available pages before exploring further.
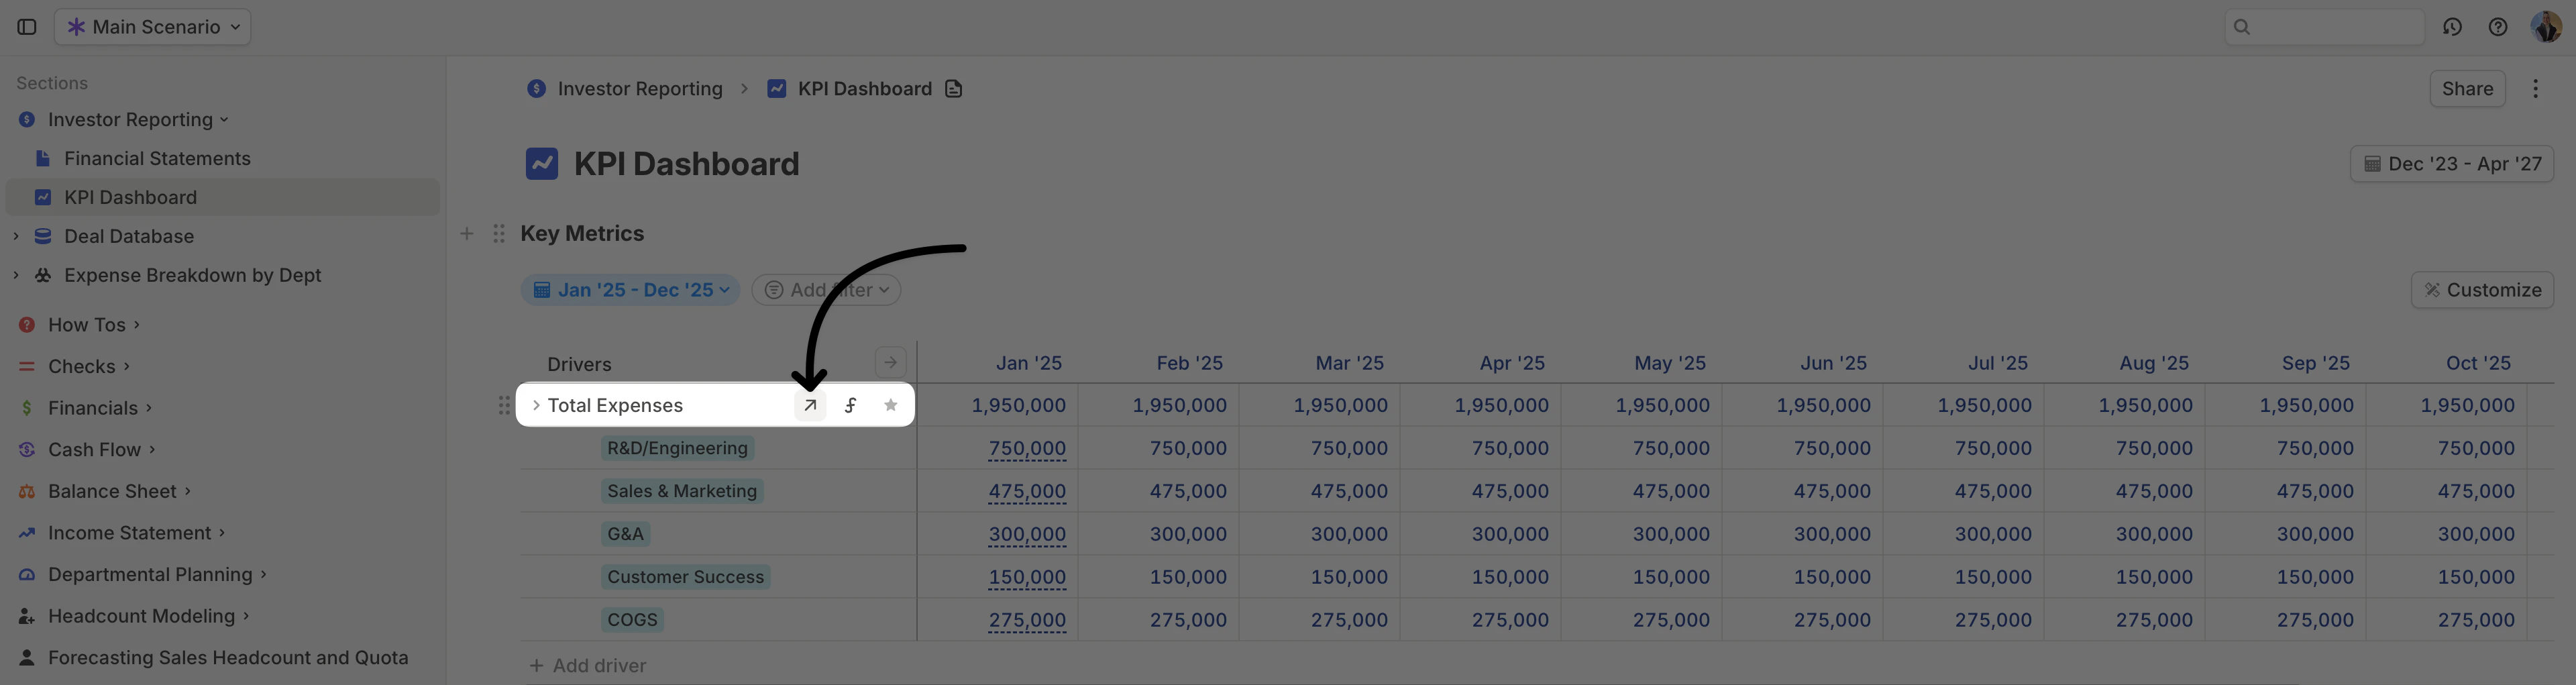
How to access the details pane
- Click the ↗️ arrow on any driver row.
- Use the shortcut
Cmd (Ctrl)+Shift+Enterwhile a driver is selected.
- Viewing and editing all driver settings in one place.
- Exploring the inputs that contribute to a driver’s values to troubleshoot discrepancies or errors.
What’s inside the driver details pane?
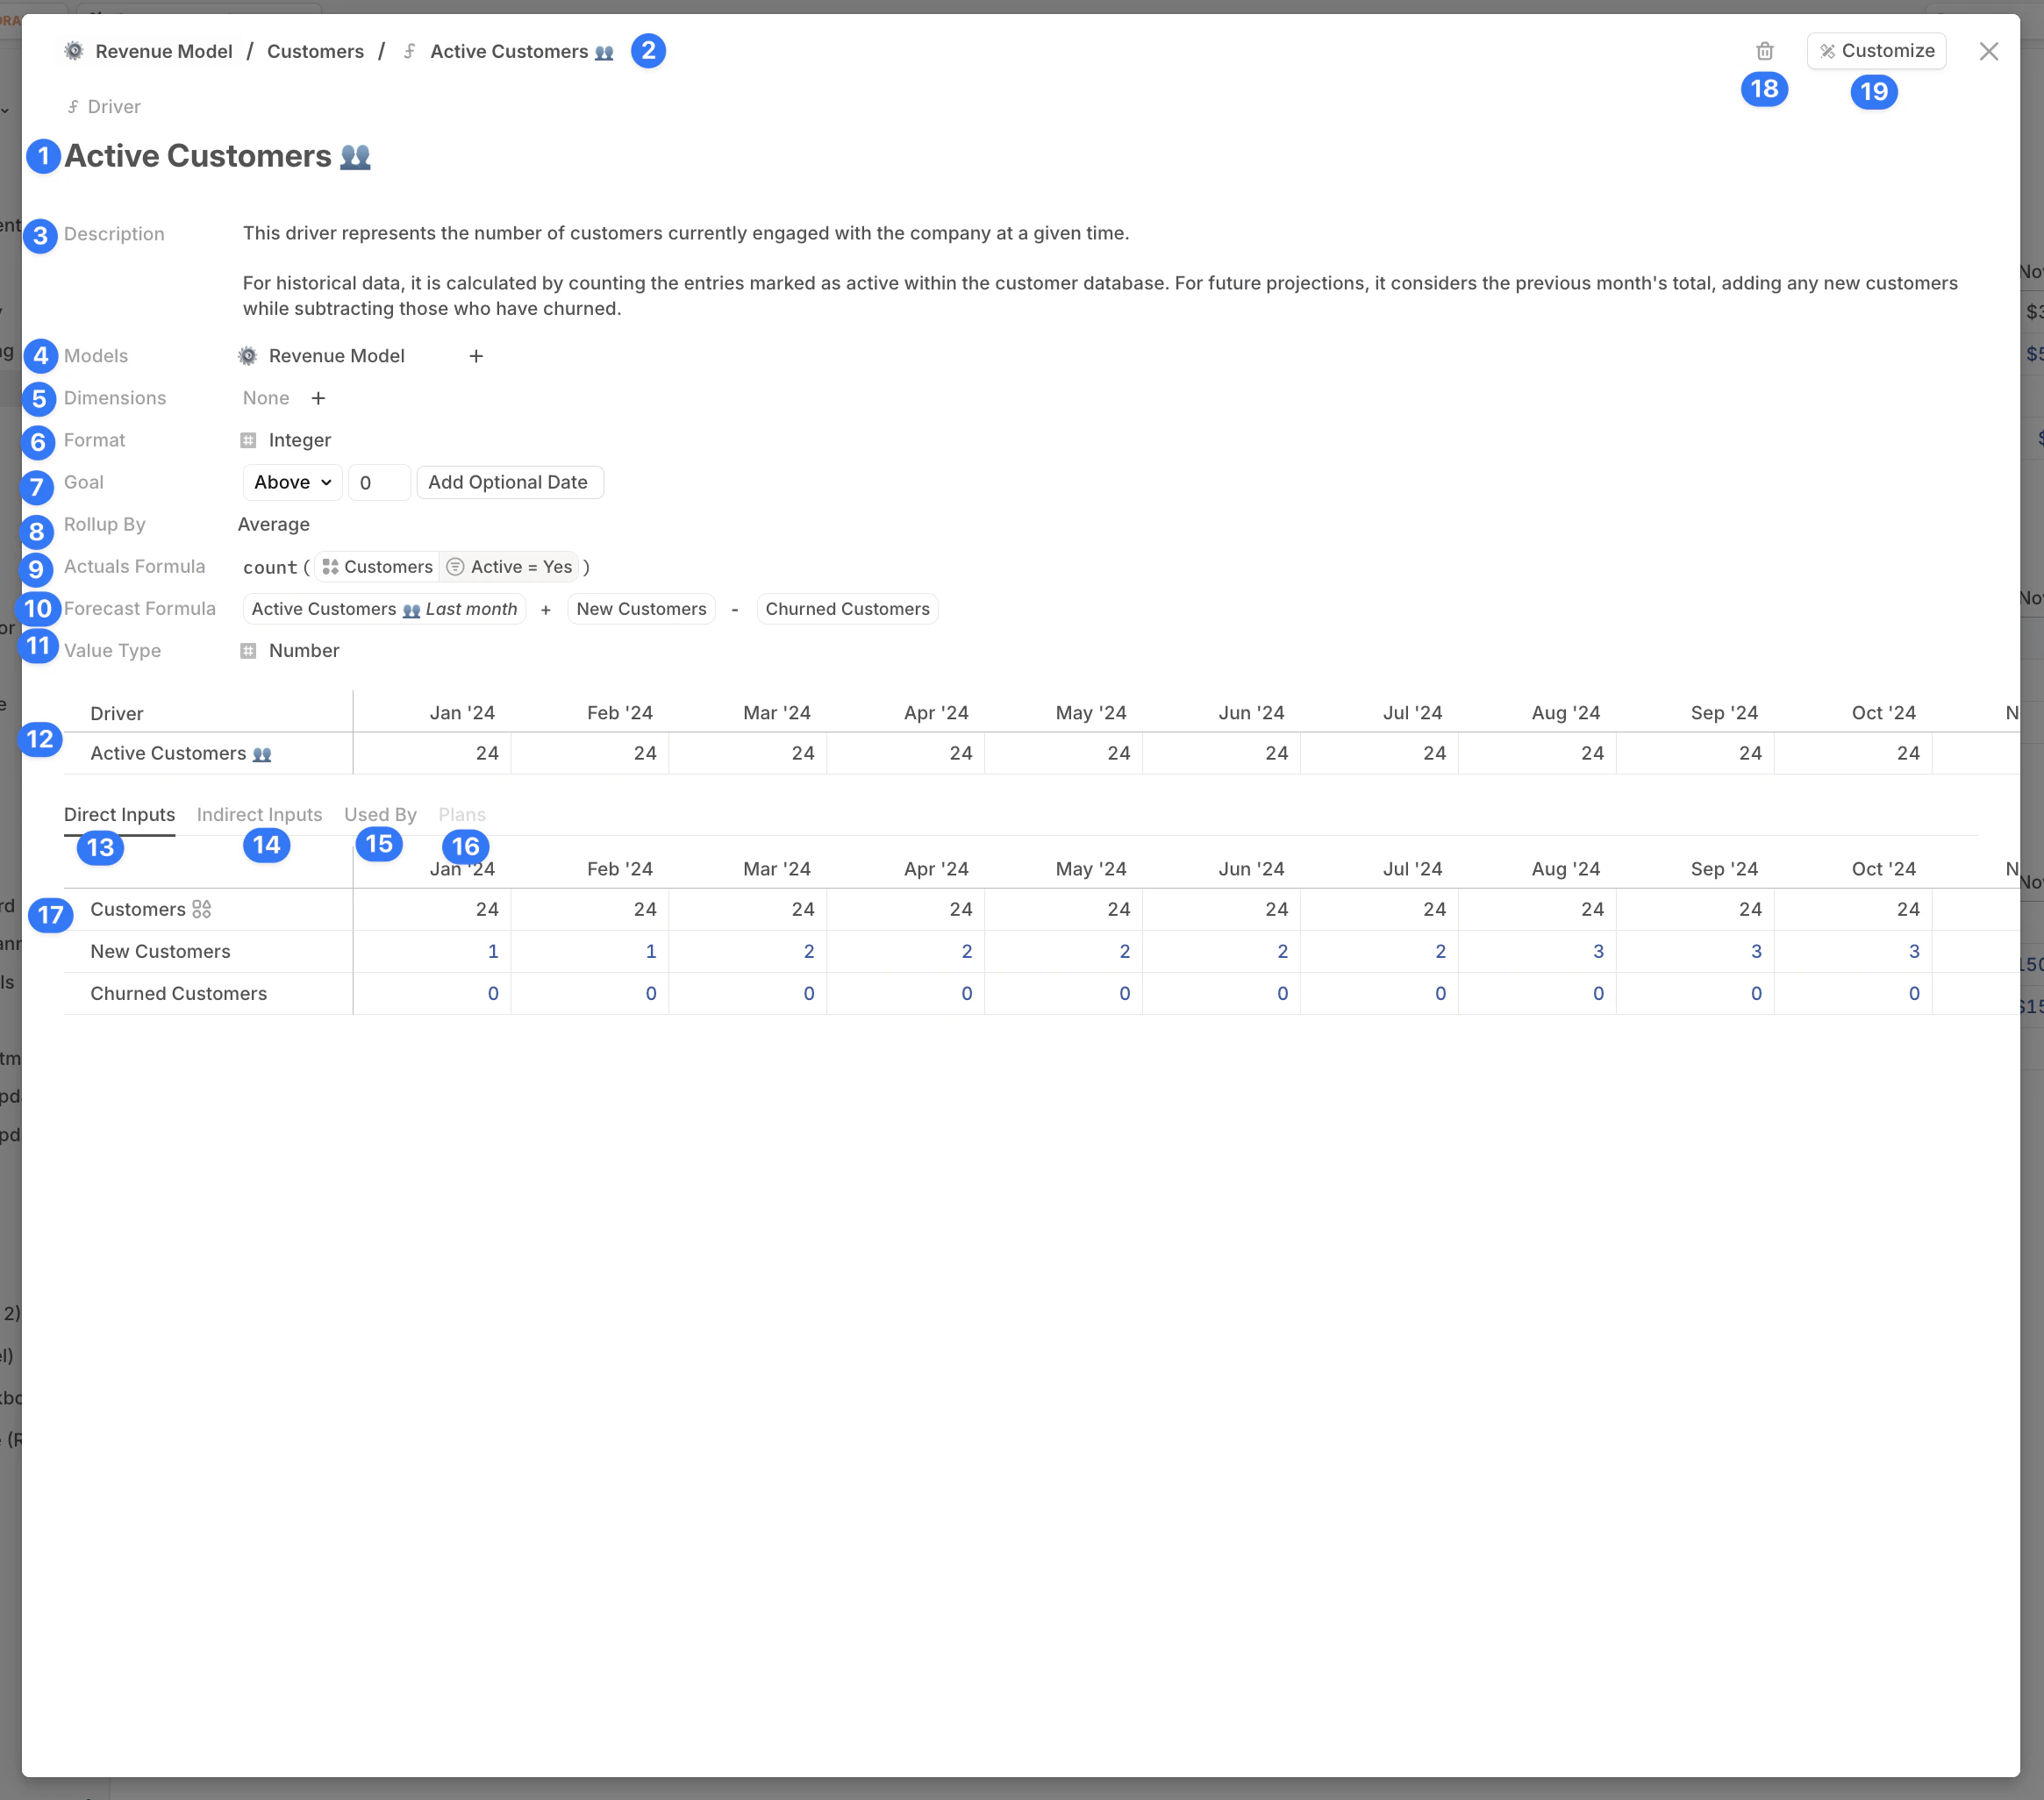
- Name – The driver’s name.
- Breadcrumbs – Shows where the driver is located in your model.
- Description – Context or notes about the driver.
- Models – Lists all pages where the driver is used.
- Dimensions – Explains how the driver is segmented. [Link: Dimensions article]
- Format – Adjusts display settings for numeric drivers.
- Goal – Assign a target value to the driver.
- The target appears as a **goal line **when plotted on a chart.
- Used in scenario comparisons or BvA (Budget vs. Actuals) to determine whether values are displayed as red or green.
- By default, higher values are considered better.
- Rollup by – Specifies how the driver’s values aggregate when viewing time periods longer than one month, such as quarterly, year-to-date, or annual (e.g. sum, first, last).
- Goal – Defines how the driver aggregates (e.g., sum, last)over longer periods (Quarterly, Annual). For example:
- Revenue → Roll up by SUM (to see total revenue in a year).
- **Cash balance **→ Roll up by LAST (to see the ending balance for a year).
- Actuals formula – Expanded space for editing the driver’s actuals formula.
- Forecast formula – Expanded space for editing the driver’s forecast formula.
- Driver type – Clearly indicates whether the driver stores Numbers or Dates.
- Driver timeseries table – A dedicated table displaying the driver’s values over time. The columns are controlled by settings under Customize [19].
- Direct inputs tab – Shows all direct inputs contributing to this driver (i.e., referenced in its formula). You can open the details pane for these inputs directly from this tab.
- Indirect inputs tab – Displays a full dependency tree, showing all direct and indirect inputs feeding into the driver. This can get long in complex models and may be truncated.
- Used by – Lists all other drivers that reference this driver in their formulas.
- Plans – Displays any Plans applied to this driver.
- Secondary / Inputs table – Displays results from the Direct Inputs, Indirect Inputs, Used By, or Plans tabs.
- Delete – Click the trash can icon to delete the driver.
- Customize menu – Adjusts which columns and time ranges are displayed in the Driver timeseries table [12] and the Secondary/Inputs Table [17].